Spatially resolved transcriptome techniques and datasets
Spatial transcriptomics
Spatial Transcriptomics (ST) is an approach that allows visualization and quantitative analysis of the transcriptome with spatial resolution in individual tissue samples. By placing tissue sections on glass slides with arrayed oligonucleotides containing positional barcodes, this method claimed to generate high quality cDNA libraries with precise positional information for RNA-seq. The barcoded microarrays have 1,007 spots of RT-primers with unique barcode sequences. Each spot has a diameter of 100 µm (corresponding to a tissue domain). The center-to-center distance is 200 µm.
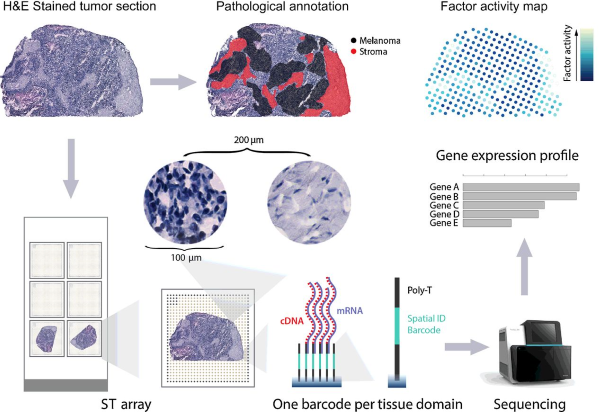
Schematics of Spatial Transcriptomics (ST). Thrane et al. Cancer Res. 2018.
Spatial transcriptome dataset
| PMID | Title | Journal | Year | Details | Browse |
|---|---|---|---|---|---|
| 27365449 | Visualization and analysis of gene expression in tissue sections by spatial transcriptomics | Science | 2016 | Details | Browse |
| 29021611 | Spatial detection of fetal marker genes expressed at low level in adult human heart tissue | Sci Rep | 2017 | Details | Browse |
| 29925878 | Spatial maps of prostate cancer transcriptomes reveal an unexplored landscape of heterogeneity | Nat Comm | 2018 | Details | Browse |
| 30154148 | Spatially resolved transcriptomics enables dissection of genetic heterogeneity in stage III cutaneous malignant melanoma | Cancer Res | 2018 | Details | Browse |
| 30948552 | Spatiotemporal dynamics of molecular pathology in amyotrophic lateral sclerosis | Science | 2019 | Details | Browse |
Slide-seq
Slide-seq is a method for transferring RNA from tissue sections onto a surface covered in DNA-barcoded beads with known positions, allowing the locations of the RNA to be inferred by sequencing. Uniquely DNA-barcoded 10-μm microparticles (“beads”) are packed onto a rubber-coated glass coverslip to form a monolayer termed a “puck”. Each bead’s distinct barcode sequence is determined via SOLiD (sequencing by oligonucleotide ligation and detection) chemistry. Ten micrometer fresh-frozen tissue sections are transferred onto the dried bead surface via cryosectioning. mRNA released from the tissue is captured onto the beads for preparation of 3′-end, barcoded RNA-seq libraries.
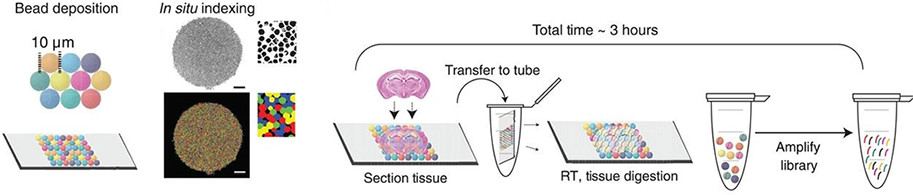
Schematics of Slide-seq. Rodriques et al. Science. 2018.
LCM-seq
Laser capture microdissection sequencing (LCM-seq) is a technique in which a laser is used to ablate small groups of cells or even single cells up to relatively large regions within a tissue section mounted on a special support matrix, and subsequently to transfer the captured material into test tubes for downstream RNA sequencing. Spinal cords isolated from mouse pups are sectioned at 12 μm thickness at cervical and lumbar levels. Motor neurons (MNs) are visualized using Histogene staining, captured by a Leica LMD7000 system and collected in PCR tubes. Cells are lysed, cDNA synthesized, amplified and analysed using a Bioanalyzer and sequencing libraries subsequently prepared. The cDNA profile is exemplified by a Bioanalyzer profile of 50 captured MNs.
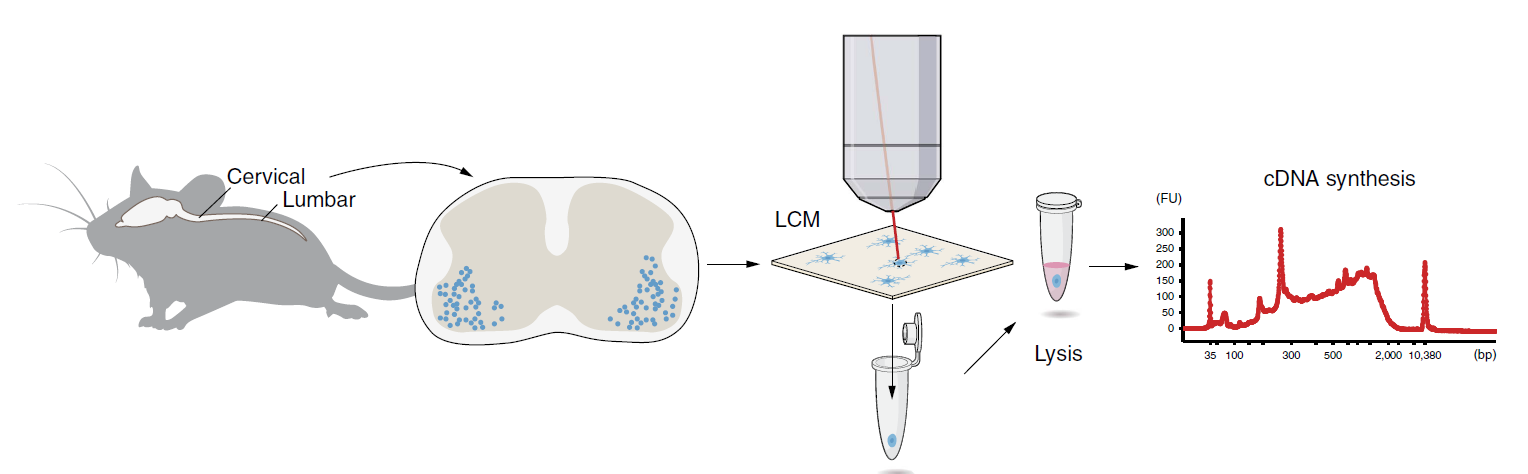
Schematics of LCM-seq. Nichterwitz et al. Nat Commun. 2016.
LCM-seq dataset
| PMID | Title | Journal | Year | Details | Browse |
|---|---|---|---|---|---|
| 24780627 | A gene expression atlas of early craniofacial development. | Dev Biol | 2014 | Details | Browse |
| 25344199 | Topographical transcriptome mapping of the mouse medial ganglionic eminence by spatially resolved RNA-seq. | Genome Biol | 2014 | Details | Browse |
| 27387371 | Laser capture microscopy coupled with Smart-seq2 for precise spatial transcriptomic profiling. | Nat Comm | 2016 | Details | Browse |
| 30270040 | Spatial reconstruction of single enterocytes uncovers broad zonation along the intestinal villus axis. | Cell | 2018 | Details | Browse |
seqFISH
Sequential fluorescence in situ hybridization (seqFISH): In seqFISH, primary probes against genes are hybridized in cells. Overhang sequences on the primary probes correspond to four rounds of barcoding. Only one twentieth of the total genes in each fluorescent channel are labelled by readout probes in each pseudocolour hybridization readout round, lowering the density of transcripts in each image. mRNA dots in each pseudocolour can then be localized by Gaussian fitting and collapsed into a super-resolved image. Each gene is barcoded within only one fluorescent channel.
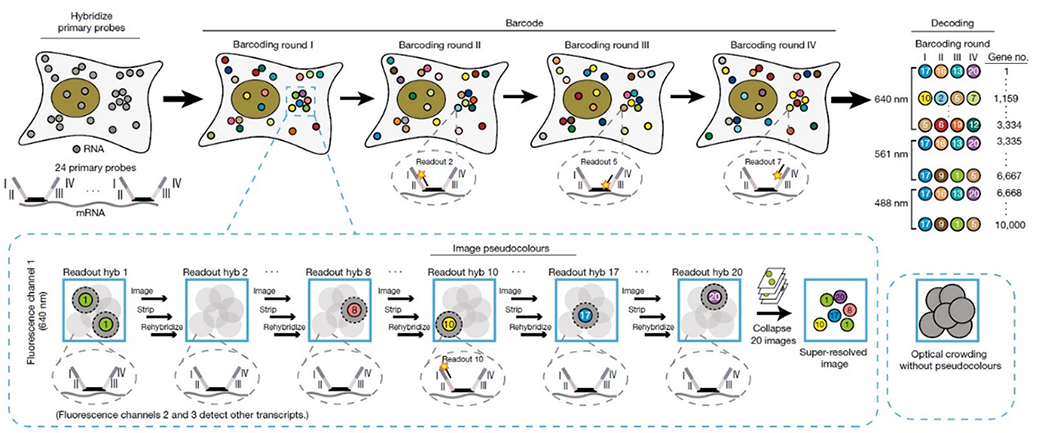
Schematics of seqFISH. Eng et al. Nature. 2019.
seqFISH dataset
| PMID | Title | Journal | Year | Details | Browse |
|---|---|---|---|---|---|
| 27764670 | In situ transcription profiling of single cells reveals spatial organization of cells in the mouse hippocampus. | Neuron | 2016 | Details | Browse |
| 30371680 | Identification of spatially associated subpopulations by combining scRNAseq and sequential fluorescence in situ hybridization data. | Nat Biotechnol | 2018 | Details | Browse |
| 30911168 | Transcriptome-scale super-resolved imaging in tissues by RNA seqFISH+. | Nature | 2019 | Details | Browse |
MERFISH
Multiplexed error-robust fluorescence in situ hybridization (MERFISH) is a single-molecule imaging method that allows thousands of RNA species to be imaged in single cells by using combinatorial FISH labeling with encoding schemes capable of detecting and/or correcting errors. Combinatorial labeling that identifies each RNA species by multiple (N) distinct signals offers a route to rapidly increase the number of RNA species that can be probed simultaneously in individual cells. Each RNA species is encoded with a N-bit binary word, and the sample is probed with N corresponding rounds of hybridization, each round targeting only the subset of RNAs that should read “1” in the corresponding bit. N rounds of hybridization would allow 2N – 1 RNA species to be probed.
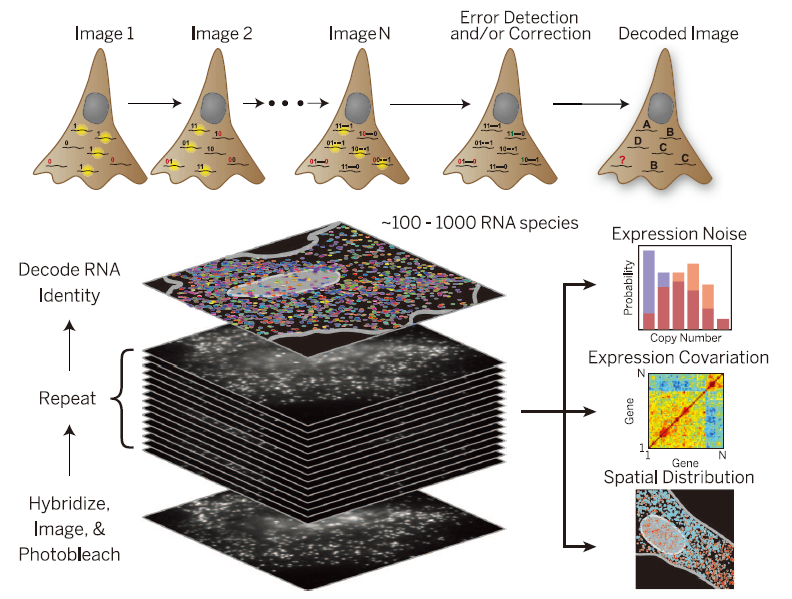
Schematics of MERFISH. Chen et al. Science. 2015.
Liver single cell zonation
Paired-cell sequencing is a method in which mRNA from pairs of attached cells are sequenced and the spatially resolved gene expression from one cell type is used to infer the pairs' tissue coordinates. This method was applied to pairs of hepatocytes and liver endothelial cells (LECs). Using the spatial information from hepatocytes, LEC zonation was reconstructed and a landmark gene panel was extracted which was used to spatially map LEC scRNA-seq data. Magnified area represents a typical porto-central sinusoidal unit. A typical unit consists of 10–15 hepatocytes and is coarse-grained into 8 or 4 concentric layers when analyzing paired cells and single cells, respectively. Paired-cell RNA sequencing utilizes the hepatocyte zonation to determine tissue localization and single-cell RNA-seq of LECs to extract LEC-specific genes. LEC zonation is obtained by averaging expression of LEC genes in the spatially localized pairs. This dataset is also used to extract LEC landmark genes for localizing single LECs.
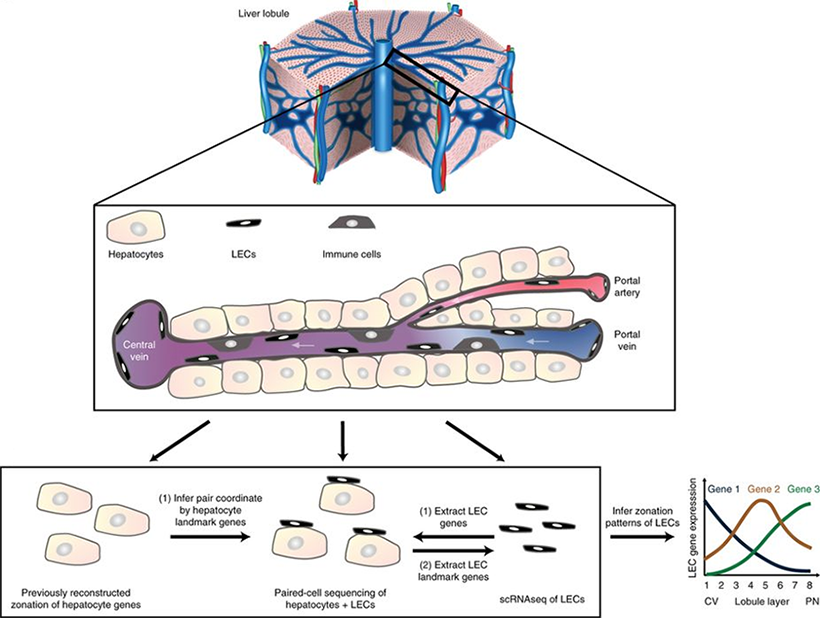
Schematics of liver single cell zonation. Halpern et al. Nat Biotechnol. 2018.
Liver single cell zonation
| PMID | Title | Journal | Year | Details | Browse |
|---|---|---|---|---|---|
| 28166538 | Single-cell spatial reconstruction reveals global division of labour in the mammalian liver | Nature | 2017 | Details | Browse |
| 30222169 | Paired-cell sequencing enables spatial gene expression mapping of liver endothelial cells. | Nat Biotechnol | 2018 | Details | Browse |
Geo-seq
Geographical position sequencing (Geo-seq) is a method that combines laser capture microdissection (LCM) and single-cell RNA-seq technology.Cells were captured by laser capture microdissection from four quadrants: anterior (A), posterior (P), and lateral (left/right, L/R), of each sample section (S1–S11) of the epiblast of late mid-streak stage (E7.0) C57BL/6 embryos, and analyzed by RNA-seq.
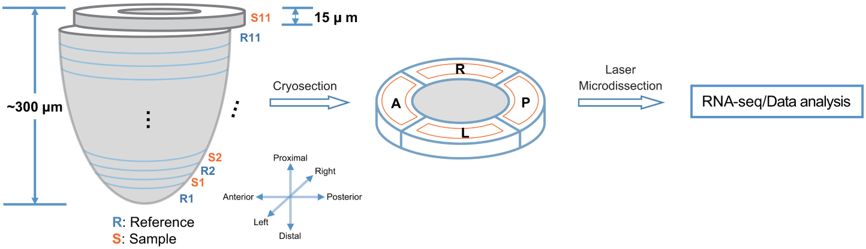
Schematics of the GEO-seq workflow. Peng et al. Dev Cell. 2016.
Tomo-seq
Tomo-seq: In Tomo-seq, samples are cryosectioned into thin slices. RNA is extracted from individual slices using the TRIzol reagent, and oligodeoxythymidine primers carrying section-specific barcodes are used to initiate reverse transcription, allowing sample pooling before library preparation. Embryos are cryosectioned into 50–100 slices and sections are collected in individual Eppendorf tubes for spatially resolved transcriptomics. RNA extraction is performed for each individual section, followed by reverse transcription. The samples are then pooled and amplified by in vitro transcription.
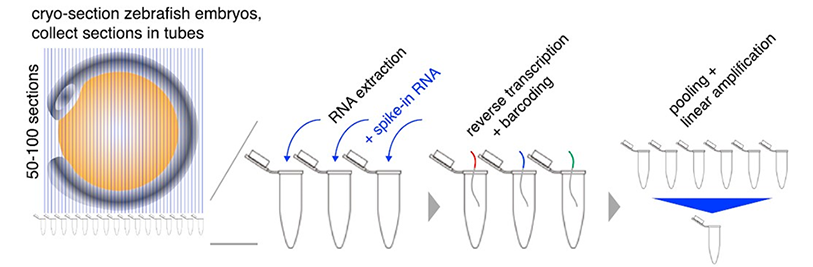
Schematics of Tomo-seq procedures in zebrafish embryos. Junker et al. Cell. 2014.
Tomo-seq dataset
| PMID | Title | Journal | Year | Details | Browse |
|---|---|---|---|---|---|
| 23028969 | Transcriptome tomography for brain analysis in the web-accessible anatomical space. | PLoS one | 2012 | Details | Browse |
| 23951250 | Sequencing mRNA from cryo-sliced drosophila embryos to determine genome-wide spatial patterns of gene expression. | PLoS one | 2013 | Details | Browse |
| 25417113 | Genome-wide RNA tomography in the zebrafish embryo. | Cell | 2014 | Details | Browse |
| 26748692 | Spatially resolved genome-wide transcriptional profiling identifies BMP signaling as essential regulator of zebrafish cardiomyocyte regeneration. | Dev Cell | 2016 | Details | Browse |
| 28724751 | Tomo-seq identifies SOX9 as a key regulator of cardiac fibrosis during ischemic injury. | Circulation | 2017 | Details | Browse |
| 29400650 | Spatially resolved RNA-sequencing of the embryonic heart identifies a role for Wnt/β-catenin signaling in autonomic control of heart rate. | Elife | 2018 | Details | Browse |
| 30416013 | Spatial transcriptomics of C. elegans males and hermaphrodites identifies sex-specific differences in gene expression patterns. | Dev Cell | 2018 | Details | Browse |