Help
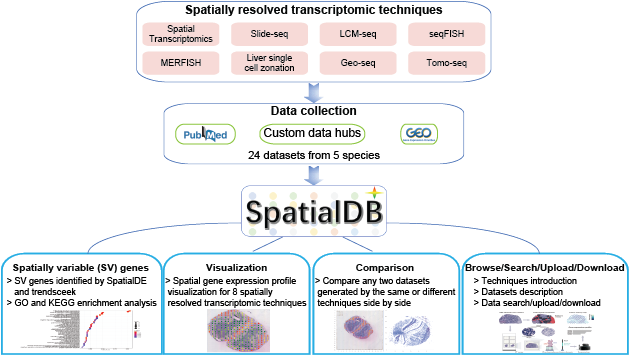
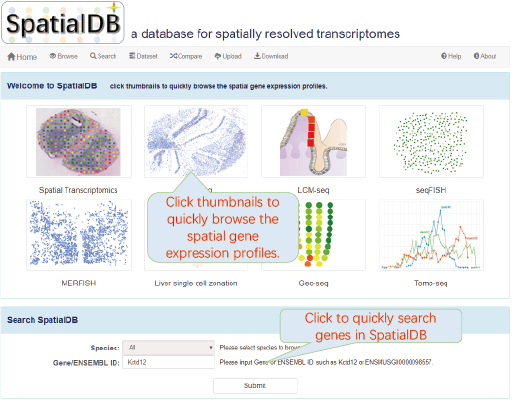
Spatially resolved transcriptomics providing gene expression profiles with positional information is key to tissue function and fundamental to disease pathology. SpatialDB is the first public database that specifically curates spatially resolved transcriptomic data from published papers, aiming to provide a comprehensive and accurate resource of spatial gene expression profiles in tissues. Currently, SpatialDB contains detailed information of datasets generated by 8 spatially resolved transcriptomic techniques (Spatial Transcriptomics, Slide-seq, LCM-seq, seqFISH, MERFISH, Liver single cell zonation,Geo-seq and Tomo-seq) from 24 studies. SpatialDB allows users to browse the spatial gene expression profile of all the 8 techniques online and compare the spatial gene expression profile of any two datasets generated by the same or different techniques side by side. It also provides spatially variable (SV) genes identified by SpatialDE and trendsceek, as well as the functional enrichment results of SV genes.
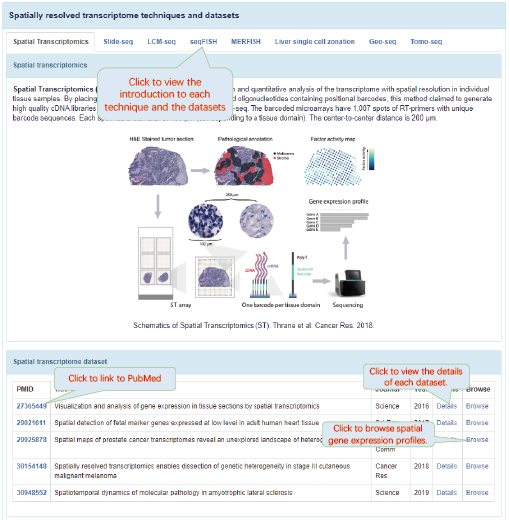
Spatial Transcriptomics (ST):
ST datasets were obtained from www.spatialtranscriptomicsresearch.org. website. Datasets contained hematoxylin & eosin stained brightfield images, gene expression profile in each spot and the coordinates of each spot. Median ratio normalization was performed using DESeq2 (Version 1.22.2). For dataset (PMID:30948552), all precessed data, images and data visualization are available at https://als-st.nygenome.org.
Slide-seq:
Raw image data of pucks, raw sequencing data, processed Slide-seq data, and NMFreg dependencies are obtained from the Broad institute’s single-cell repository (https://portals.broadinstitute.org/single_cell/study/slide-seq-study). Five pucks from coronal hippocampus, sagittal cerebellum, kidney, Liver and sagittal cortex were processed for visualization. Cells were kept if their total read counts were more than 100. Genes were kept if their read counts were more than 300 in all cells.
LCM-seq:
LCM-seq datasets were downloaded from GEO database. For datasets from PMID 24780627 and 27387371, the coordinates of each spot were obtained from t-SNE analysis.
seqFISH:
seqFISH datasets were obtained from GEO database and supplementary information of articles. For dataset (PMID:30371680), expression data, spatial coordinates, SVM predictions, HMRF domains, expression box plots categorized by domains and cell types, and interactive visualizations are available at http://spatial.rc.fas.harvard.edu
MERFISH:
MERFISH datasets were downloaded from https://datadryad.org/resource/doi:10.5061/dryad.8t8s248.Cells were kept if their total read counts were more than 300.
Liver single cell zonation:
Liver single cell zonation datasets were downloaded from GEO database.
Geo-seq:
Geo-seq datasets were downloaded from GEO database.
Tomo-seq:
Zebrafish datasets were downloaded from http://zebrafish.genomes.nl/tomoseq/. C. elegans datasets were downloaded from http://celegans.tomoseq.genomes.nl/. Other datasets were obtained from GEO database and supplementary information of articles.
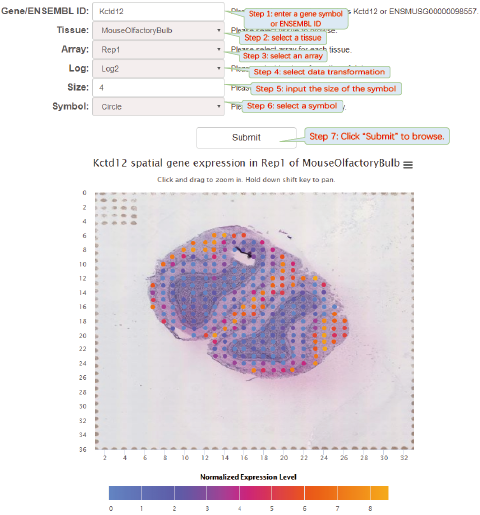
Spatial gene expression profile visualization will help biologists further explore the datasets. Although some visualization softwares have been developed, it is difficult for biologists to install and maintain these softwares. SpatialDB provides online visualization of spatial gene expression data from 8 spatially resolved transcriptomic techniques. Data visualization was implemented based on JavaScript libraries: jQuery.js, d3.js and Highcharts.js.
click thumbnails to quickly browse the spatial gene expression profiles.
Spatial Transcriptomics
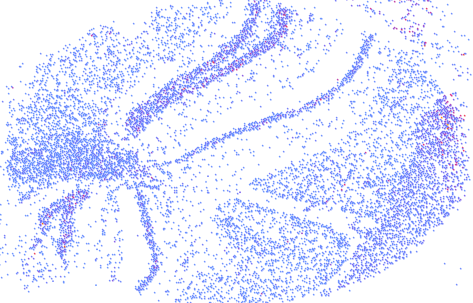
Slide-seq
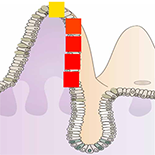
LCM-seq
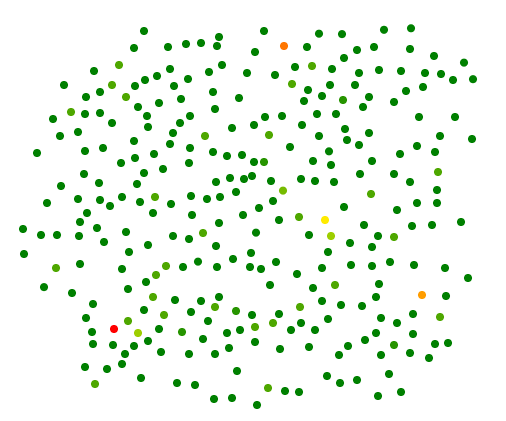
seqFISH
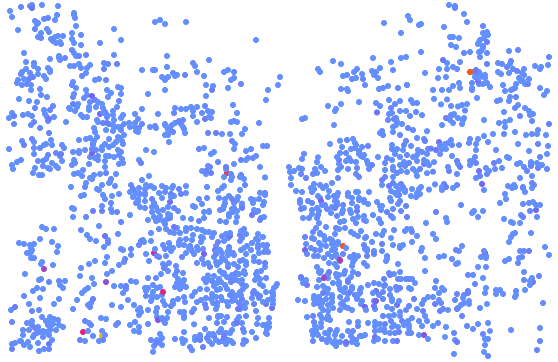
MERFISH

Liver single cell zonation
Geo-seq
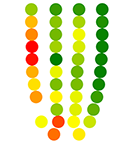
Tomo-seq
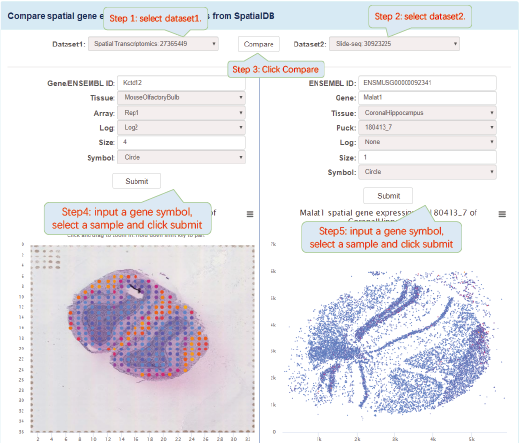
The visualization of spatially resolved transcriptomic data is implemented using Highcharts framework. Scatter and heatmap modules of Highcharts are used to implement the visualization of datasets generated by 8 techniques: Spatial transcriptomics, Slide-seq, LCM-seq, seqFISH, MERFISH, Liver single cell zonation and Geo-seq. Line module is used to implement the visualization of datasets generated by Tomo-seq. SpatialDB enables users to compare the spatial gene expression (compare two genes from the same sample, compare two genes from different samples of the same dataset, compare two genes from different datasets generated by the same or different techniques) implemented by the same strategy.
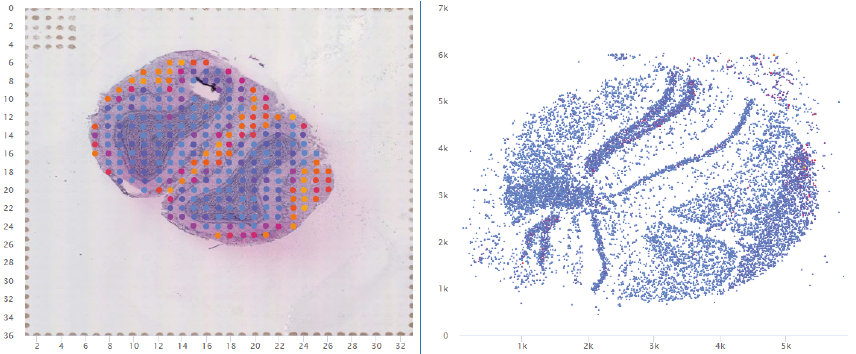
4.1. Click to Compare Spatial Gene Expression (Scatter and Heatmap Modules)
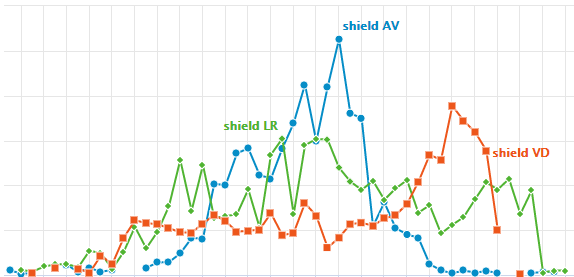
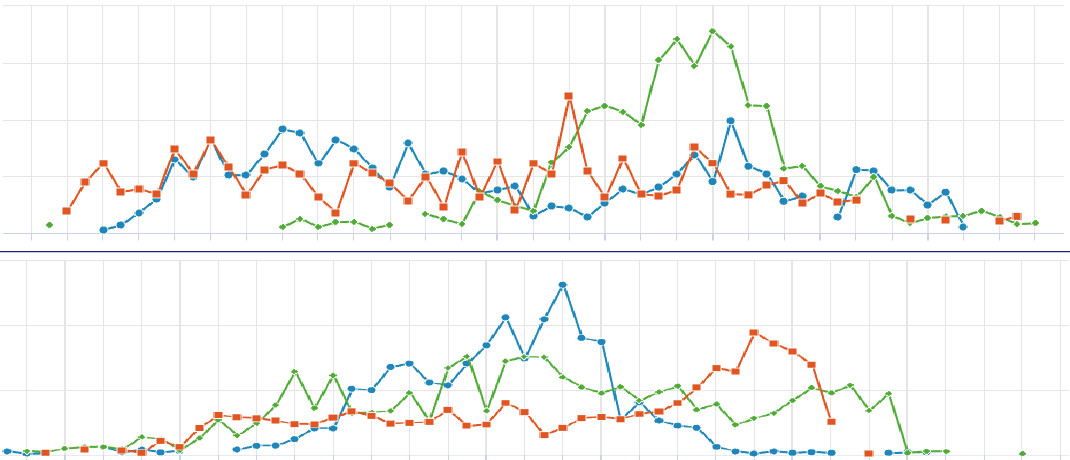
4.2. Click to Compare Spatial Gene Expression (Line Module)
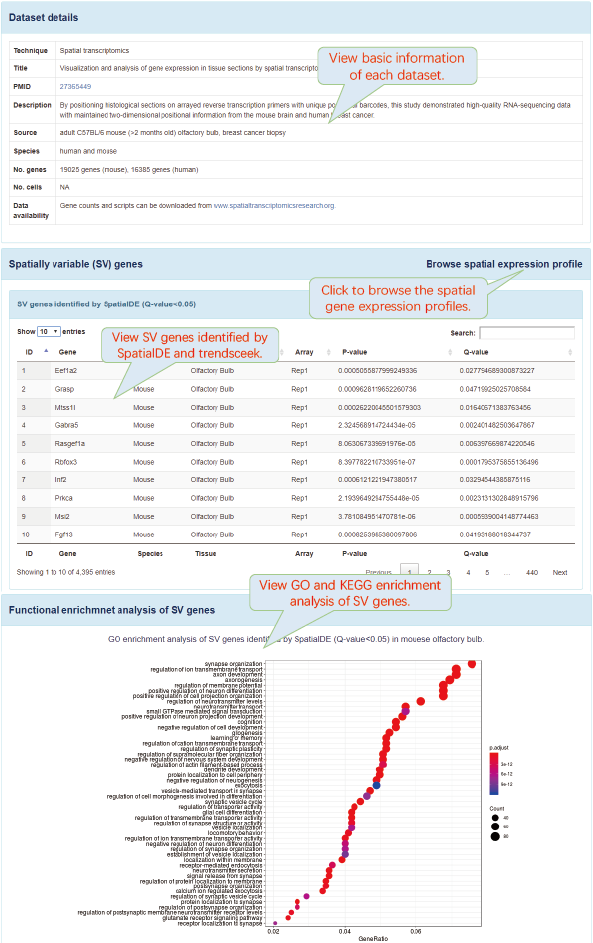
SV genes were identified by SpatialDE and trendsceek. SpatialDE and trendsceek are two bioinformatics analysis tools that can directly identify genes with spatially structured expression patterns in tissues. SpatialDE was derived from Gaussian process regression from geostatistics. Trendsceek was derived from marked point processes from geostatistics, astronomy and materials physics.
SpatialDE:
Source code: https://github.com/Teichlab/SpatialDE
trendsceek:
Source code: https://github.com/edsgard/trendsceek
Functional enrichment analysis of SV genes was performed using clusterProfiler package.
Parameters:
GO: ont='ALL',pAdjustMethod = 'BH',pvalueCutoff = 0.05,qvalueCutoff = 0.2,keyType = 'ENTREZID'
KEGG: pvalueCutoff = 0.05, pAdjustMethod = 'BH', minGSSize = 10,maxGSSize = 500,qvalueCutoff = 0.2,use_internal_data = FALSE
Source code: https://bioconductor.org/packages/release/bioc/html/clusterProfiler.html
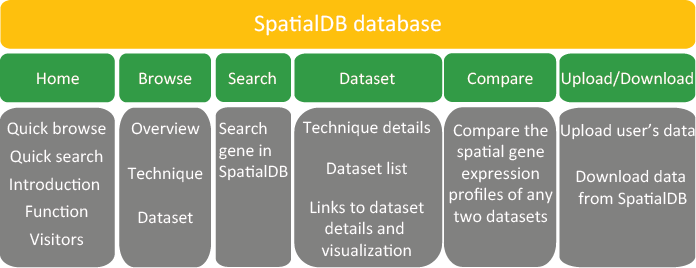
6.1. Website structure
6.2. Homepage
6.3. Dataset
6.4. Details
6.5. Browse
6.6. Compare